-
iPoint
 iPoint-systems
iPoint is your partner for Product Compliance and Sustainability
All features for creating Sankey diagrams
e!Sankey is specialized to draw one specific type of diagram: Sankey diagrams.
It provides all features and many different design options to visualize energy flows and material streams as appealing flow diagrams.
Create appealing Sankey diagrams easily and quickly. Learn about functions & features of the software that make the set-up of your charts even more comfortable, e.g. by linking values in a Microsoft Excel worksheet to flows in the diagram.
Try it out yourself with the free 14-day trial version of e!Sankey. It contains a large number of sample diagrams and also comes with a full user manual that will help you understand all functions of the software.
You can create the first professional Sankey diagrams within a few minutes.


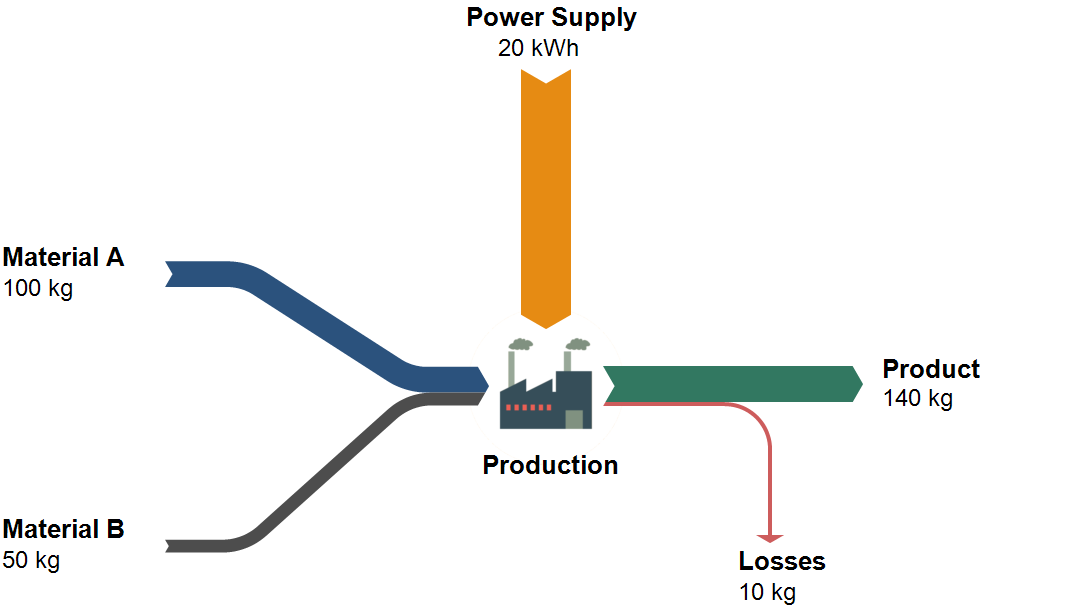
Drawing Sankey diagrams is easy as pie
Building up Sankey diagrams is intuitive and only requires knowledge of a few basic functions of the software:
- Set a process (node)
- Draw an arrow between the processes
- Drag & drop material or energy flow entries into arrow
- Add quantity of material or energy
The correct width of the Sankey arrows is calculated and drawn automatically based on the flow quantities entered. Proportionality and scaling of flows is ensured, even when elements of the diagram are moved.
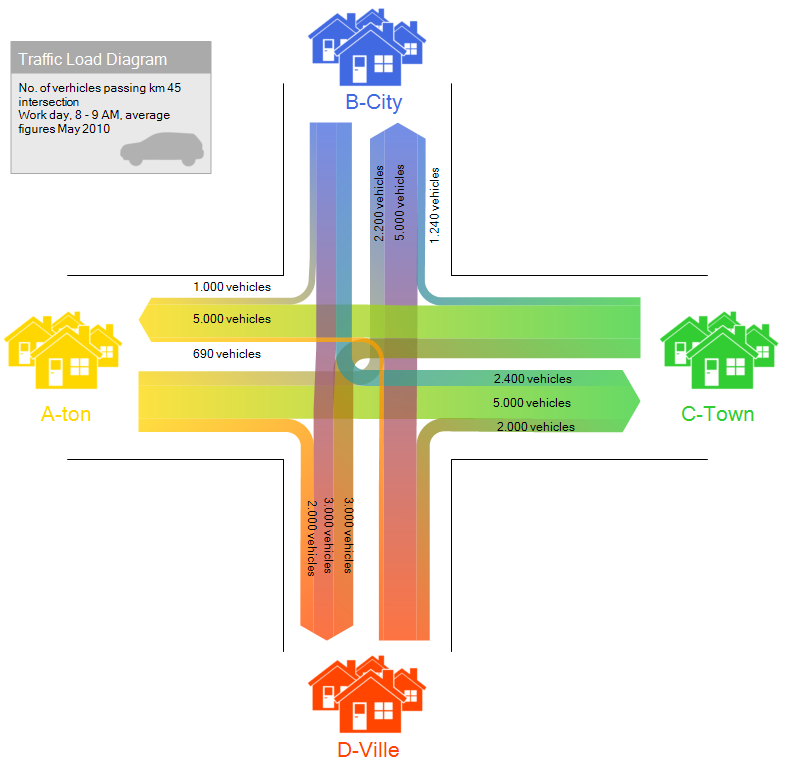
Numerous layout & design options
Once the Sankey diagram with its arrows has been set up, it can be adapted and refined. Many different layout options are available in e!Sankey to make the diagram look good:
- Adapt arrow routing: insert waypoints to determine the arrow routing. Also, you might want to define that arrows must dock at a specific side of the process symbol
- Alignment: Use grid, align process symbols and set arrow docking (bottom, center, top)
- Design arrow heads: can be turned on or off, shape and size of arrow spikes can be set
- Icons or images: personalize your diagram using process symbols
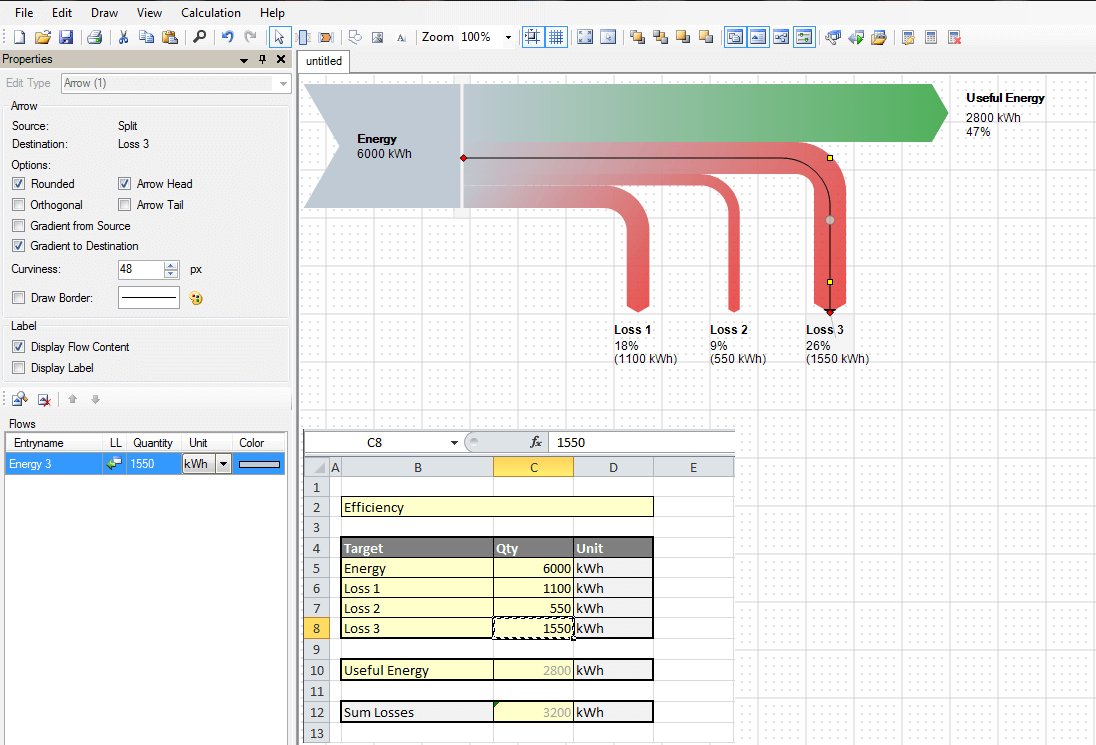
Updating Sankey diagrams with data from Microsoft Excel
When doing monthly reports, or regularly publishing flow data, it is often sufficient to just update the values in the Sankey diagram.
To this end the Live Link to Microsoft Excel can be used: flows in the diagram reference into cells in a workbook. When these values in Microsoft Excel change, the flow quantities are adapted and the arrows get updated accordingly.
By the way: this mechanism of updating Sankey diagrams with data from external sources can also be automated using e!Sankey SDK. This opens new possibilities to integrate Sankey diagrams in other software solutions, such as e.g. energy management software.
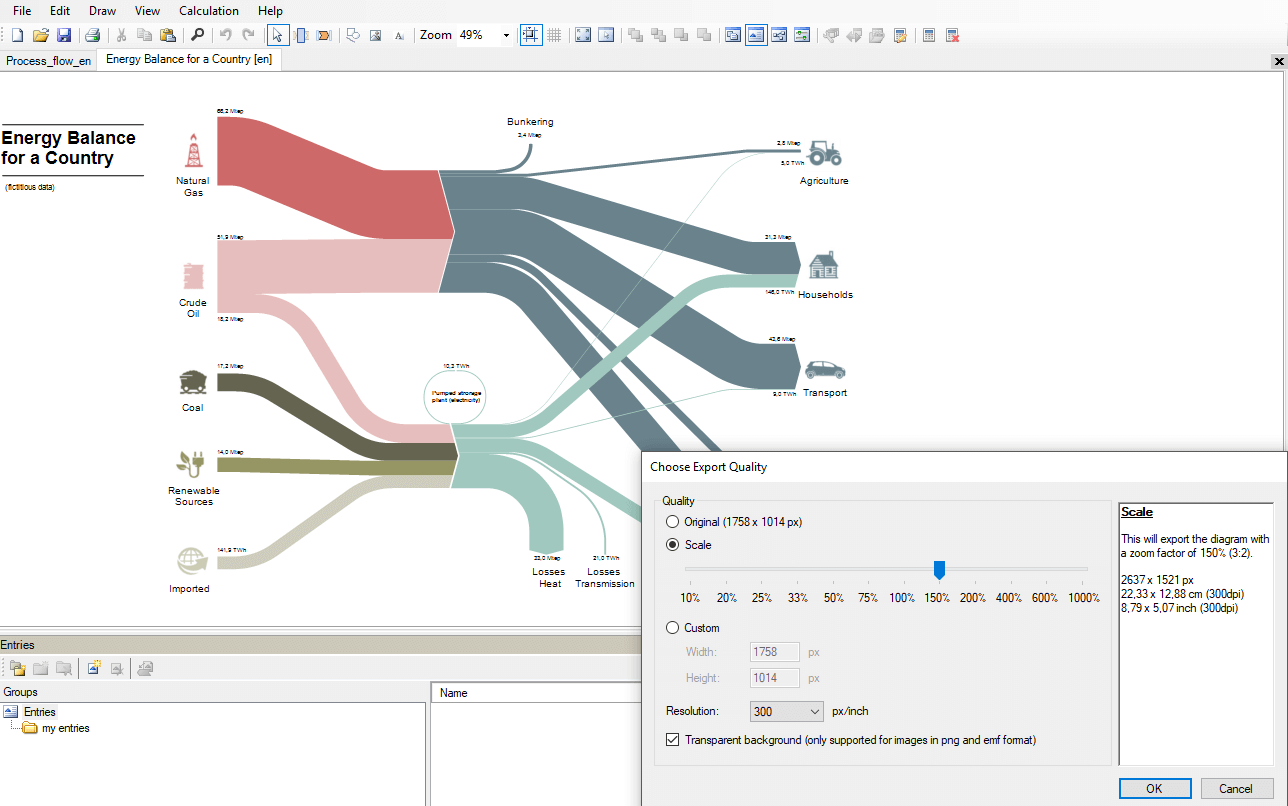
Export Sankey diagrams as image file
After creating your diagram, you can export it as an image file, to show it in a report or to include it in a PowerPoint presentation. Scaling and image resolution can be defined in a dialog. The following graphical file formats are available:
- BMP, GIF, JPG & PNG
- EMF
- SVG (only pro/calc version)
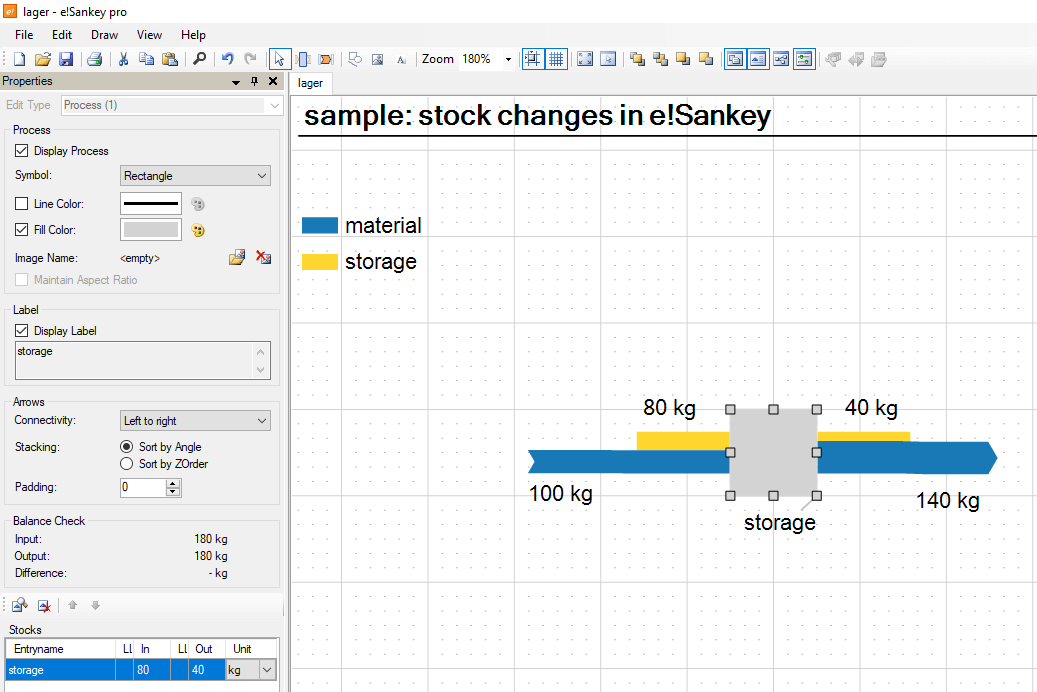
Visualization of balance differences
Balance differences (i.e. between the input and output flow sums) at a node can be determined and a warning symbol can be shown.
They can be shown using stubs or by displaying a balance label explicitly showing the difference. Balance labels can be configured in many ways.
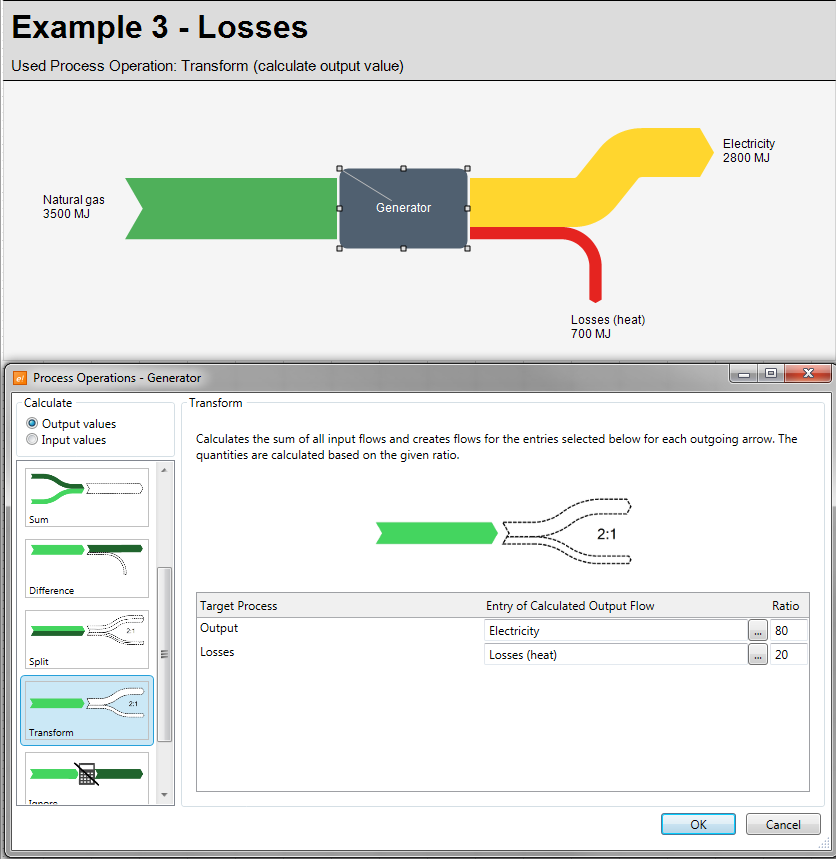
Calculation of flows with simple operations
Using simple mathematical operations in processes allows calculatin flows in your Sankey diagram, e.g. if certain data is missing. This feature available in e!Sankey calc only:
1. Sum:
Calcuates the sum of all input flows and creates a flow at output arrow.
2. Merge:
Takes all flows from all incoming arrows and passes them to the output arrow. Flows of the same entry will be summed up.
3. Difference:
Calculates the difference of the surrounding flows and creates a flow at the output arrow.
4. Split:
Takes all flows from all input arrows and passes them to the output arrows. Flows are split by given ratio.
Software for drawing Sankey diagrams.
Software for drawing Sankey diagrams
with Live Link to Microsoft Excel
Software for drawing Sankey diagrams.
Includes features for calculating flows.
Feature Comparison
| e!Sankey basic | e!Sankey pro | e!Sankey calc | |
|---|---|---|---|
| Numerous features for drawing Sankey diagrams | |||
| Manage flows, units, scaling, colors | |||
| User interface in 6 different languages (EN, FR, DE, ES, PT, zh-CN) | |||
| Balance check for input and output flows | |||
| Export diagrams (BMP, GIF, JPG, PNG, PDF) | |||
| Export in EMF and SVG vector graphics format | |||
| Live Link to Microsoft Excel | |||
| Visualization of stock changes | |||
| Link files and URLs from diagram elements | |||
| Calculation of flows through process operations | |||
| > To the Shop | > To the Shop | > To the Shop |