Automation & Integration of Sankey Diagrams
Use the engine of the popular Sankey diagram software e!Sankey in your solution
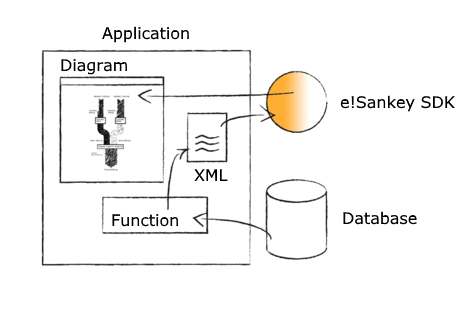
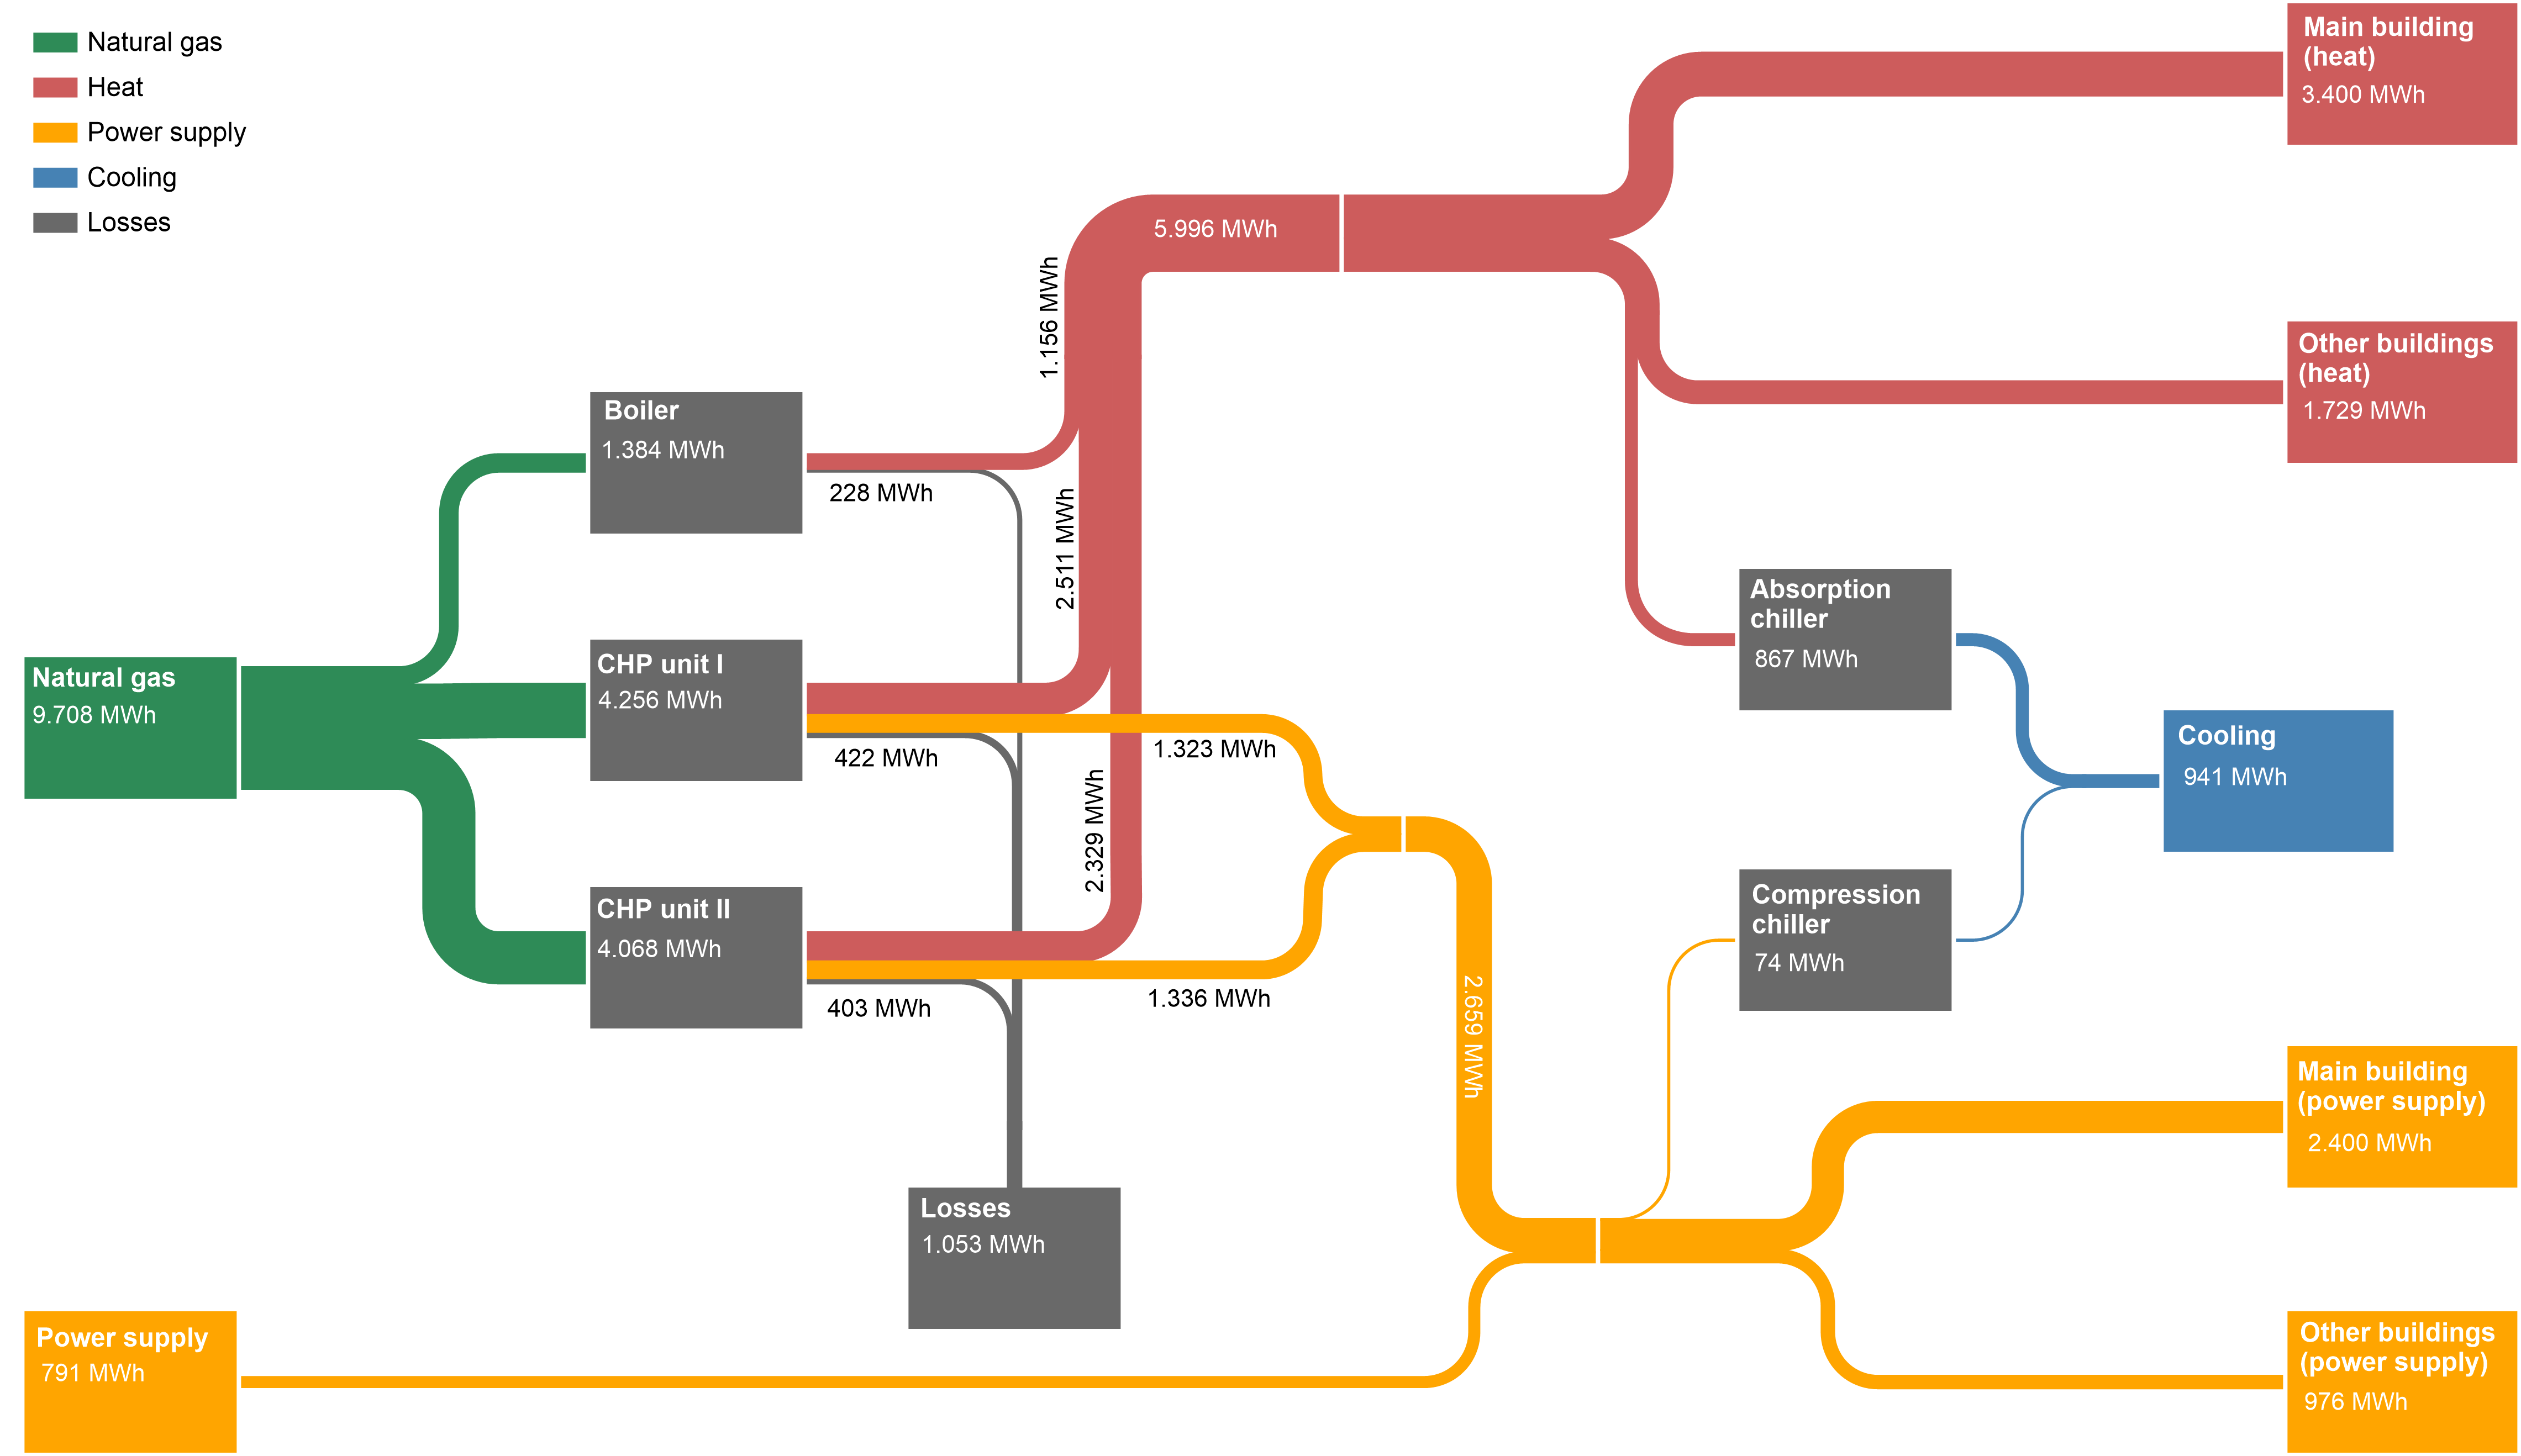
Using the e!Sankey SDK you can create and update Sankey diagrams with values from data available in your application.
These Sankey diagrams can be shown on the Web or integrated into your energy management system, facility management application or production control software.
The e!Sankey SDK comes with a comprehensive documentation and a number of code samples.
Choose from two different licensing models
e!Sankey SDK - Automate
The 'Automate' license model is used for enabling server-based applications or web solutions to produce high-quality Sankey diagrams. You will be able to develop and configure the automatic creation of material or energy flow visualisations on your own server, or at your customers site.
e!Sankey SDK - Redist
The 'Redist' license model allows for integration of components (libraries) from the e!Sankey SDK into your own software package. Your solution can be redistributed to your customer under your own license model. Your own software is enabled to produce Sankey diagrams.


How to automate Sankey diagrams
Feeding Sankey diagrams with values from CSV data
A simple CSV file or stream with ID/value pairs serves as the data source to feed an existing Sankey diagram template. The Sankey diagram updates the elements identified by the ID with the given flow value, stock value or text.
Automatic building of Sankey diagrams from XML data
This serves to build a new Sankey diagram programmatically from an XML file or stream. The XML contains structural information such as nodes and their coordinates, arrows, materials, quantities and unit types. This feature can be used when diagram layout is not fixed beforehand or changes repeatedly.
e!Sankey SDK - sample
In this video you can see an example chart where data is read from CSV files and with the help of e!Sankey SDK the chart is constantly updated and played out as an image file.
- Three processes feeding material (blue, red, yellow flows) into a production process.
- Stocks increasing and decreasing.
- Fictitious data from a simple CSV file.

Examples of successful implementation
Successful implementations of the integration of Sankey diagrams in energy measurement data management, plant control and facility management can be found, among others, in:
- MESSDAS Energy Management System (Hochhuth GmbH, Germany)
- SiloVEDA (Girsberger Informatik, Switzerland)
- ProCoS Energy Management Software (Kisters AG, Germany)
- Sankey diagrams in LabVIEW (HAW Hamburg, Germany)
- Application in power plants (Oy Indmeas AB, Finland/Sweden)

Get in touch with us
Should you wish to test the e!Sankey SDK, please contact us. We can provide a trial package including a comprehensive technical documentation of the Software Development Kit.
We will be happy to share with you information on the technical requirements and discuss possibilities for integrating Sankey diagrams into your application.
Contact us

